Skip links

Distribution and
sales channels

Get information about distribution and sales channels in Mongolia and other countries in this section.
Mongolian
Republic Korea
When planning your distribution or sales channels for other markets, please refer to the Country Commercial Guide (CCG) in the Exporter tools section of the Export Solutions menu on the US Department of Commerce International Trade website and select a country for more information.
There are the following methods of export products to foreign markets: 
  • Direct export.
  • Sell via distributor, branches and agents.
  • Establish joint-venture abroad.
  • Produce on contract.
  • License and franchise.

Japan

Japan’s distribution channels have undergone significant consolidation over the past two decades. Distribution channels for consumer goods and manufactured goods are very different. Due to limited space and urban population density, small shops remain the main point of sale. Because of this, retailers only withdraw in small quantities, and wholesalers need to deliver products in smaller quantities and at shorter intervals.
Japanese culture prefers face-to-face business and honesty and responsibility in relationships. The cost of this inefficient distribution system increases the final price of the product to the consumer. This model negatively affects the growth of large suburban retail centers and online shopping.
Japan’s current distribution channel and sales system is still tied to the ‘keiretsu – 系列’ (related suppliers) system. These large business groups, which include banks and trading companies, are deeply involved in Japan’s trade negotiations. Although this keiretsu system is greatly weakened, these corporations have a business proposition that covers all stages of the industry, from production to distribution channels. Their advantages based on economies of scale, existing relationships, and customer loyalty make them easier and more efficient for their customers, making them formidable competitors for smaller companies. The distribution channels controlled by these companies are a limiting factor for new companies looking to export to Japan. Japan’s main logistics and distribution hubs are the major ports in Tokyo, Yokohama, Kobe, Osaka, and Fukuoka.

Use agent and distributor: For many companies, establishing a company directly in Japan is the best way to enter the Japanese market. But for many small and medium-sized companies, a more realistic first step is to use an agent and distributor. Great care must be taken in choosing an agent and negotiating the terms of the contract. It is not appropriate for companies to use the method of cold calling with potential agents in Japan. Most Japanese businessmen prefer to do business with someone they know very well, have met face-to-face, usually through a trusted intermediary. Suitable third parties for such introductions include other Japanese companies, (Mongolian) companies doing successful business in Japan, banks, trade associations and chambers, the Japan External Trade Organization (JETRO), and representative offices of that country (Mongolia) in Japan.

As in any country, companies in the country (Mongolia) should do extensive due diligence before choosing a partner. The common issues of the agreement should be whether the country’s (Mongolian) products will be sold and promoted compared to other products, compete directly with Japanese products, and whether sufficient attention will be paid to market recognition.

Japanese distributors usually cover specific territories and industries. Importers usually choose one agent for all countries. Sometimes exclusive contracts require strong efforts to expand sales through Japanese agents. However, if the capacity and willingness of the Japanese agents to develop the relevant market is in doubt, the conclusion of an exclusive contract is not a condition. 

With an agent contract, suppliers send invoices to agent customers for the amount sold (“back-to-back”). After that, the percentage of the sale is paid to the agent in the percentage specified in the agent’s contract. According to the distributor contract, the supplier buys the goods from the distributor and determines the price to be sold to the end user, and the percentage of additional sales is a matter of the distributor’s authority. Sales percentages vary by product and contract terms. In general, the percentage of sales is 10-20% for “one-time” (irregular) transactions, and 5-10% for regular and regular business transactions. In the case of abundant raw materials (for example, iron ore, coal), it is relatively low, around 1-3%. Due to the complexity of the product, the percentage of sales for medical, laboratory and scientific test equipment is often high, 20% or more. 

Once an agent or distributor agreement is drawn up and the country’s (Mongolian) products are firmly established in the Japanese market, the country’s (Mongolian) company may want to establish a representative office to support the distributor’s sales and marketing activities and communication with the country’s (Mongolian) head office.

Open a branch: Starting a branch is relatively easy. According to the World Bank’s Ease of Doing Business report, it takes about 11 days to set up a business, and in addition to the company stamp and registration fees, it costs 0.7% of the investment amount (or ¥60,000 or more). There may be other options for opening a branch or representative office, both of which are easier and less expensive. However, there are some restrictions in terms of activities. A ‘shared’ office (i.e., private or semi-private office space plus secretarial and IT staff services) may also be an option for companies operating in major Japanese cities.
Before opening a branch in Japan, companies from the country (Mongolia) must register with the Japanese Ministry of Economy, Trade and Industry (METI) () You can familiarize yourself with foreign investment support programs. These programs include the Japan Bank for International Cooperation  and the Development Bank of Japan. Market entry level business support programs are implemented by the Japan External Trade Organization (JETRO) and some city and prefectural governments.

Franchising: US franchising has had a strong influence on the development of the Japanese franchising industry since the early 1970s. Although Japanese consumers are generally receptive to the US franchising concept, in order to be successful, products and services need to be adapted to local needs and expectations in Japan. Mongolia’s franchising business has relatively little opportunity to develop and enter other countries, but this type of business should be considered. There are several forms of franchising to enter the Japanese market. For example, signing a contract with a master franchisee, establishing a wholly-owned branch as a master franchise with a boutique or service center, or establishing a joint partnership. Finding the right partner in Japan takes time and effort. It is difficult to find a company willing to invest in a master franchise or a business that does not have a clear market or strong growth potential in Japan. Therefore, continuous market research and long-term efforts are necessary for companies considering opening a franchise business in Japan.For more information visit the Japan Franchise Association website (https://www.jfa-fc.or.jp.e.ek.hp.transer.com/)).

Direct marketing: Japanese direct marketing includes mail orders, telemarketing, television and internet direct sales. According to the data of the World Federation of Direct Selling Associations (WFDSA ), Japan has 15.6 billion US dollars as of 2019, followed by the United States, China, Korea, and Germany. It is the 5th largest direct trade market in the world. The largest product groups are beauty and personal care products (39%), health products (24%) and household products (19%). Although direct sales in Japan have been on a slight decline since 2016, there are 2.9 million sales reps in the industry, more than 87% of whom are women. According to the Japan Direct Marketing Association , the most common way for consumers to obtain product information is through the Internet on computers, followed by the Internet on mobile devices, and through printed catalogs. Young people are particularly adept at accessing product information through mobile devices. Japanese direct marketers use websites that are optimized for both desktop and mobile devices to reach consumers. Although online trade is growing rapidly, catalog trade is still common in Japan. There are also major Japanese catalog brands that operate online shopping sites, such as Belluna, Senshukai-Belle Maison, Dinos-Cecile, Nissen, Scroll, and Cataloghouse-Tsuhan Seikatsu.

Joint venture/Licensing): For the most up-to-date information on the regulations for starting this type of activity in Japan, please visit JETRO’s website or consult with an experienced and reputable legal or tax advisor. License agreements may cover copyrights, know-how, patents, service marks, trademarks, and trade secrets..

Express delivery service: Japan’s postal system, with nearly 24,000 post offices nationwide, has consistently been ranked among the best in the world for service and accessibility. Due to the density of Japan, most domestic packages are delivered within 1-2 days. Special same-day express delivery services start at ¥800 and are available in 5 major cities in Japan. Postage fees for international packages using Japan Post are based on size, weight, and distance, and start at around ¥1,400.

Trademark

A trademark is a distinctive expression used by citizens and legal entities to distinguish their goods and services from the goods and services of others.
Law on Trademarks and Geographical Indications
3.1.1. “trademark” means distinctive expression used by a natural or a legal person in order to distinguish the goods or services from those of others;
4.1. Trademarks may be expressed in words, figures, letters, numerals, three-dimensional configurations, colors, sounds, scents or any combinations thereof.
In 2021, the Intellectual Property Office received 4,642 trademark applications, which has increased by 452 applications (10.8%) compared to 2020. In 2021, 3,308 trademarks were granted protection certificates, which has decreased by 720 trademarks (17.9%) from the previous year. According to Article 9.3 of the Law on Trademarks and Geographical Indications, trademark certificates are valid for 10 years, and as of 2021, 51,784 trademark certificates are valid. Number of valid trademarks has increased 1.9%-5.9% for last three years.
Number of trademark applications and trademarks with protection certificates and valid trademarks
2018
2019
2020
2021
Trademark applications – total
4,374
4,603
4,190
4,642
Domestic applications
1,431
1,581
1,663
2,222
Foreign applications
576
619
529
502
International applications filed under the Madrid Agreement and Protocol
2,367
2,403
1,998
1,918
Trademarks with protection certificates – total
3,505
3,927
4,028
3,308
Valid trademarks
45,696
47,983
50,809
51,784
Source: Intellectual Property Office (https://www.ipom.gov.mn/mn.php?page=53)
According to the “World Intellectual Property Indicators 2021” by the World Intellectual Property Office (WIPO) , in 2020, 13.4 million applications of 17.2 million trademarks were received through 168 intellectual property agents worldwide, representing a 13.7% increase in the number of trademarks and a 16.5% increase in the number of applications from 2019. As of 2020, 64.4 million trademarks are valid worldwide. China, the USA, Japan, Iran, the European Union, and regional intellectual property agents are leading in terms of the total number of trademark applications received.
China leads in terms of the number of trademark applications per one million (1,000,000) people, which was 5,425 for the country in 2019. This figure was 2,619 in England, 1,950 in Singapore, 1,402 in the United States, 1,323 in Armenia, 1,037 in Brazil, and 236 in India. As of 2019, the number of trademarks per 1,000,000 people in Mongolia was 1,191.

Industrial design

An indicator of a country’s production and design development and the level of creativity of citizens can be the industrial design applications and number of patents issued in that country and internationally.

Law on Intellectual Property

5.1. The following intellectual property rights shall be protected
5.1.1. copyright and related rights;
5.1.2. Industrial property rights.
7.1. Industrial property rights include:
7.1.1. invention;
7.1.2. innovation;
7.1.3. industrial design;
7.1.4. trademark;
7.1.5. geographical indication.
7.3. The state administrative body in charge of intellectual property matters shall register the items specified in Articles 7.1.1, 7.1.2 and 7.1.3 of this Law and issue a patent, items specified in Articles 7.1.4 and 7.1.5 and issue a certificate in accordance with relevant procedures.

Patent LAW
3.1.2. “industrial design” means a new and original solution related to the shape, pattern or color, or a combination of colors in an article;
3.1.4. “patent” means a document granted by a responsible government authority certifying the recognition of the given solution as an invention or industrial design, and granting the exclusive right to own the invention or industrial design to the creator for a fixed period of time;
3.1.6. “creator” means a person who devised an invention, industrial design or utility model by his mental creativity;

In 2021, the Intellectual Property Office (IPO) received 361 industrial design applications, which has increased by 72 applications (24.6%) compared to 2020. In 2021, 221 industrial design patents were granted, which has decreased by 4 patents (1.8%) from the previous year. According to Article 15.1 of the Patent Law, industrial design patents are valid for 10 years, and by the end of 2021, there are 2,786 valid industrial design patents.
Industrial design applications, number of granted patents and valid patents
2018
2019
2020
2021
Industrial design applications – total
269
300
293
365
Domestic applications
140
180
167
249
Foreign applications
38
3
4
3
International applications filed under the Hague Convention
91
117
122
113
Granted industrial design patents – total
271
215
225
221
Domestic applications
143
95
102
104
Foreign applications
40
3
1
4
International applications filed under the Hague Convention
88
117
122
113
Valid industrial design patents
3,742
3,279
2,643
2,786
Source: Intellectual Property Office (https://www.ipom.gov.mn/mn.php?page=53)

According to the “World Intellectual Property Indicators 2021” by the World Intellectual Property Office (WIPO), in 2020, 1.1 million applications of 1.4 million industrial designs were received through 154 intellectual property agents worldwide, representing a 2% increase in the number of industrial designs and a 5.6% increase in the number of applications from 2019. China, the European Union, the Republic of Korea, the United States, and Turkey are leading in terms of the number of industrial design applications.

The Republic of Korea is the leader in the number of industrial design applications per one million (1,000,000) people, and the figure for the country was 1,187 in 2019. This figure was 105 in Ukraine, 70 in the United States, 31 in Russia, 20 in Brazil, and 7 in India. As of 2019, the number of industrial design applications per 1,000,000 people in Mongolia was 91.
Number of industrial design applications per million (1,000,000) people, as of 2019
Source: “World Intellectual Property Indicators 2020”, WIPO.

Trade Map database and analytic tools of the International Trade Center:

Nowadays, export market opportunities are developed based on the Trade map database of the ITC. To conduct this type of research, the Relative Advantage Index or RCI (Revealed comparative advantage indices) of export/import is used.

Searching for information on foreign trade requires knowledge of classifications and codes used in international trade and customs statistics, such as the Harmonized System.

(https://intracen.org/ )
(https://www.trademap.org/Index.aspx)

Statistical data, compilations, and research reports issued by the statistical organization of the respective country, city, or local government:

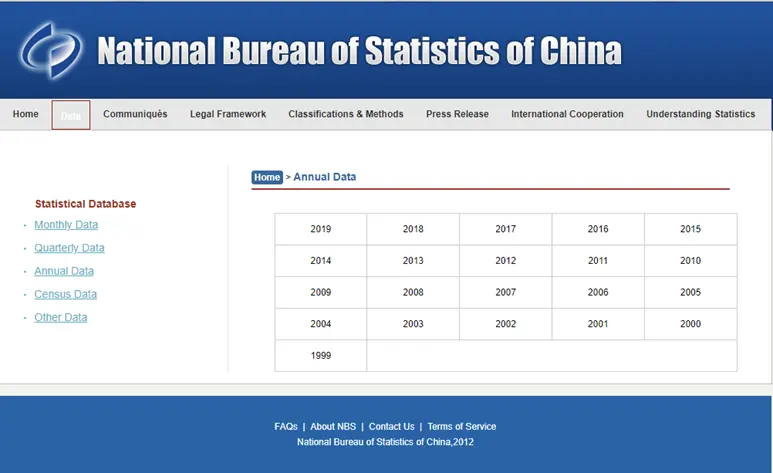
Statistics of China can be obtained from the website of the National Bureau of Statistics of China. You can view the annual statistical data (China Statistical Yearbook) online by clicking on the Annual Data section in the Data menu of the website. Information (tables and data) is available for all of China and regions of interest by province (Inner Mongolia, Hebei, Shanxi, etc.), by city (Hohhot, Urumqi, Baotou, Harbin, etc.) and by industry and topic (price data, retail and food industry).
http://www.stats.gov.cn/english/Statisticaldata/AnnualData/

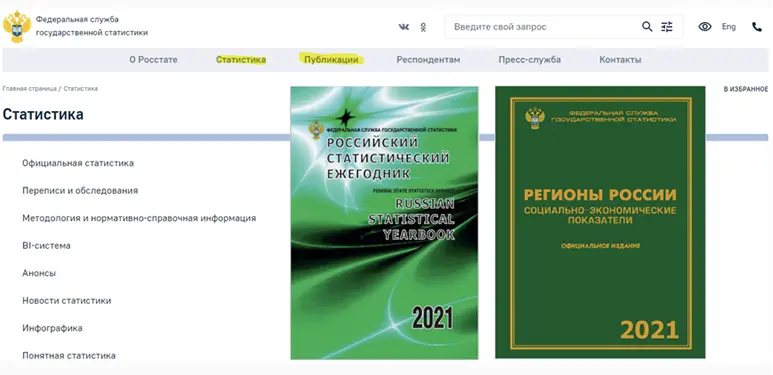
Statistics of the Russian Federation (RUS) can be found on the website of the Federal Statistical Service (Федеральная служба государственной статистики – Росстат) statistic for annual statistical compilations (статистический ежегодник) and regional socio-economic indicators.

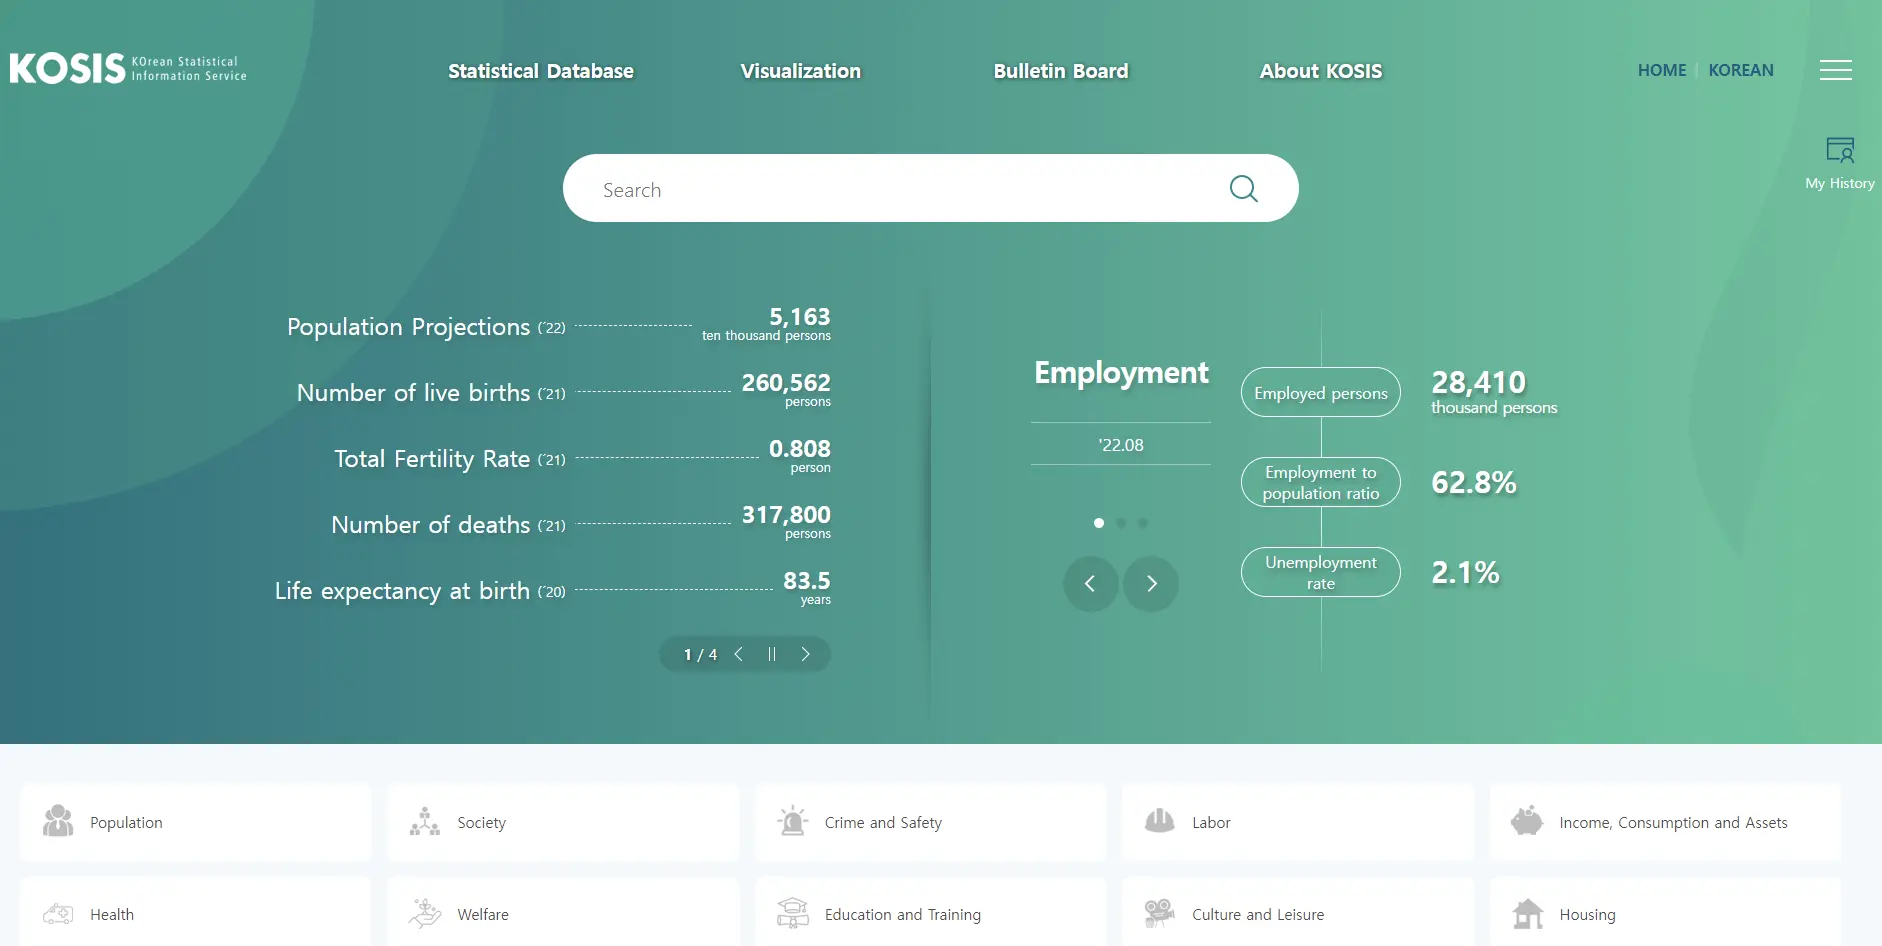
As for Korea, the Korean Statistical Information Service (KOSIS ) provides statistical information to users, similar to the Mongolian Statistical Database

As for Japan, statistical information published by the Statistics Bureau of Japan can be obtained from the organization’s website. https://www.stat.go.jp/english/

Statistical data, compilations, and research reports issued by the statistical organization of the respective country, city, or local government :

From the Statistics menu of the website of the Korea International Trade Association (KITA), it is possible to get information about which countries Korea imports what kind of products. Searching for information on foreign trade requires knowledge of classifications and codes used in international trade and customs statistics, such as the Harmonized System of Commodity Identification and Coding. http://kita.org/

Mongolia’s main export countries, such as Russia, Korea, China, and Japan, are producing and exporting countries themselves, so ministries and government agencies do not usually publish reports and information about domestic production, trade, and consumer markets. However, it would be more effective to collect and use data from government organizations, agencies, and institutes that support foreign trade and small and medium-sized industries (SMEs). For Mongolian manufacturers who intend to export their products, it will be possible to establish contact with these organizations, supply semi-finished products and raw materials, cooperate with manufacturers and traders of the country and region, and obtain information and research about the market of the region. For example, through the Russian Export Center, it is possible to contact the entrepreneurs of the Republic of Buriat.
https://www.exportcenter.ru/en/

Market research report and database of research and consulting agencies that produce and sell market research reports and information:

Often these types of market research reports and databases require a fee to use. Such reports can provide more detailed and specific information. In most cases, these agencies publish general statistics and historical survey data in a way that can be viewed and used immediately for free, but access to detailed reports and databases for more detailed reports and updated figures requires a fee. If you find general statistics and previous research data sufficient, you can use them directly. If you are more serious and can afford to pay that amount, you can also purchase reports and information.
These types of agencies have become a major part of the marketing research industry. According to the 2021 report of the Global Marketing Research Market issued by ESOMAR, the global professional research association, in 2020, income of such activities (Reporting) reached 24.9 billion USD, which occupied 27.7% of total income from marketing research industry.
“Reporting” is the activity of obtaining data from relevant sources, verifying and analyzing it (analyzing secondary data), and then delivering it to customers and users. Forms of delivery include selling reports and data online, paid use, organizing presentations, and giving business consultations based on research and data. Collecting primary data is not the main business but making recommendation is available at such companies as Gartner, Forrester, Mintel, IHS Markit, Euromonitor, Deloitte, McKinsey & Co., PwC etc.
“Global Market Research 2021: An ESOMAR Industry Report in cooperation with BDO Accountants & Advisors” ESOMAR, 2022 “ESOMAR’s Global Top 50 Insights Companies 2022: Presenting the leaders of the industry” ESOMAR, July 2022

IHS Markit offers more than 1,500 databases (Data Lake), more than 350 research reports and recommendations (Industry Cases), 5,000 researchers and consulting services of industry experts in the automotive, international trade, mining, financial services, and agriculture industries. https://ihsmarkit.com/

IBIS World covers more than 1,000 industries, and from the Asia-Pacific region only China, Australia and New Zealand market data is published. Of course, there is a fee to download and use databases and reports, but general information and basic statistics can be downloaded and used directly for free. IBIS World’s industry report is free to download and include relevant information, and the report provides important information for developing your future business plans and strategies, such as industry market size, trends, key industry players, and SWOT analysis. Just enter a few details such as country, surname, email address and download the free report. It may not contain the exact information you’re looking for, but hopefully you’ll find plenty of inspiration here. https://www.ibisworld.com/

Economic Intelligence Unit’s data report may be too general. However, there is an advantage in that the country’s industry experts provide advice on issues to consider when entering the market. The Country Analysis section contains analytical reports containing information on economic opportunities and risks for more than 190 countries. боломж, эрсдэлийн талаарх мэдээллийг агуулсан аналитик тайлан байдаг. https://www.eiu.com/

Statista’s data research is more suitable for our needs. On Statista’s platform, you can view statistical information and thematic research reports about the market of a given country and the market of a given type of product. It contains reports and statistics from more than 150 countries and 170 industries. https://www.statista.com/

Official statistical database of the National Statistical Office

Other sources of information about the market of Mongolia

Coming soon …

Coming soon